Introduction
In this first blog post, I seek to gain a better understanding of past U.S. presidential elections that have taken place after World War Two. This analysis, which will include an exploration of national popular vote margins, state-level margins, and state-level swings, will help guide my first predictive model for the 2024 presidential election and will help seek answers to the following questions:
- How competitive are presidential elections in the United States?
- Which states vote blue/red and how consistently?
Historical Two-Party Vote Share
National Results:
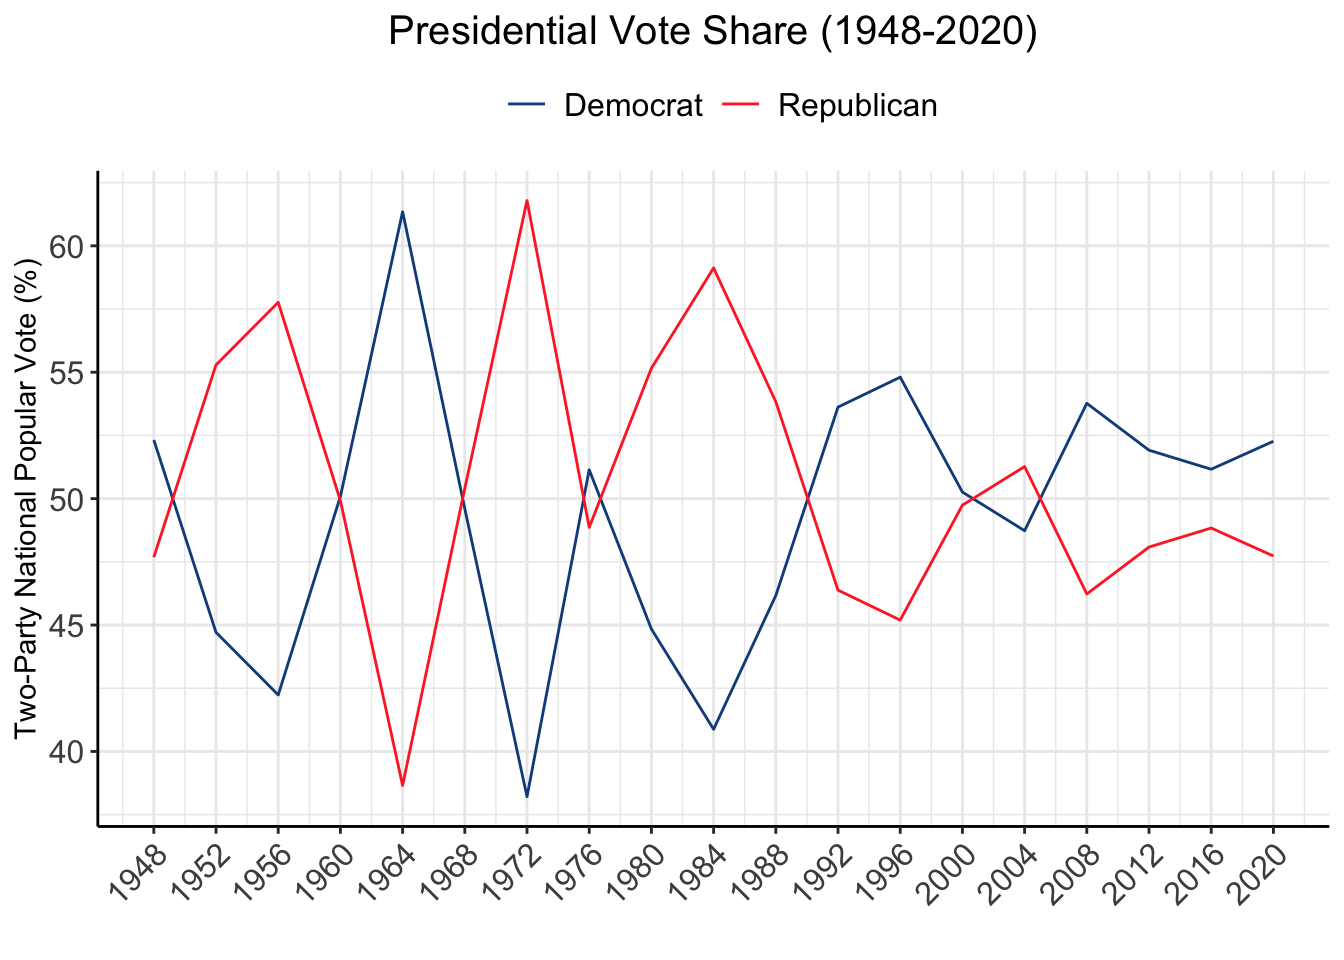
Looking at the graphic below, which displays the two-party national popular vote in U.S. presidential elections after FDR, it becomes clear that in the modern era presidential elections in the United States are consistently competitive. Even in blowout electoral victories, such as those in 1964, 1972, and 1984, the losing party’s candidate still wins roughly 40% of the vote. Meanwhile, partisan control of the presidency regularly switches hands between the two major parties. However, while elections have remained fairly competitive over the last roughly 85 years, the national popular vote margin has seemingly gotten narrower in recent decades.
State-Level Results:
This was only the national popular vote, however, and because the United States notoriously elects its presidents using the electoral college rather than the nationwide popular vote, it is important to analyze the history of state-level presidential election results as well. The below graphic shows which party won in each state in every election since 1980:
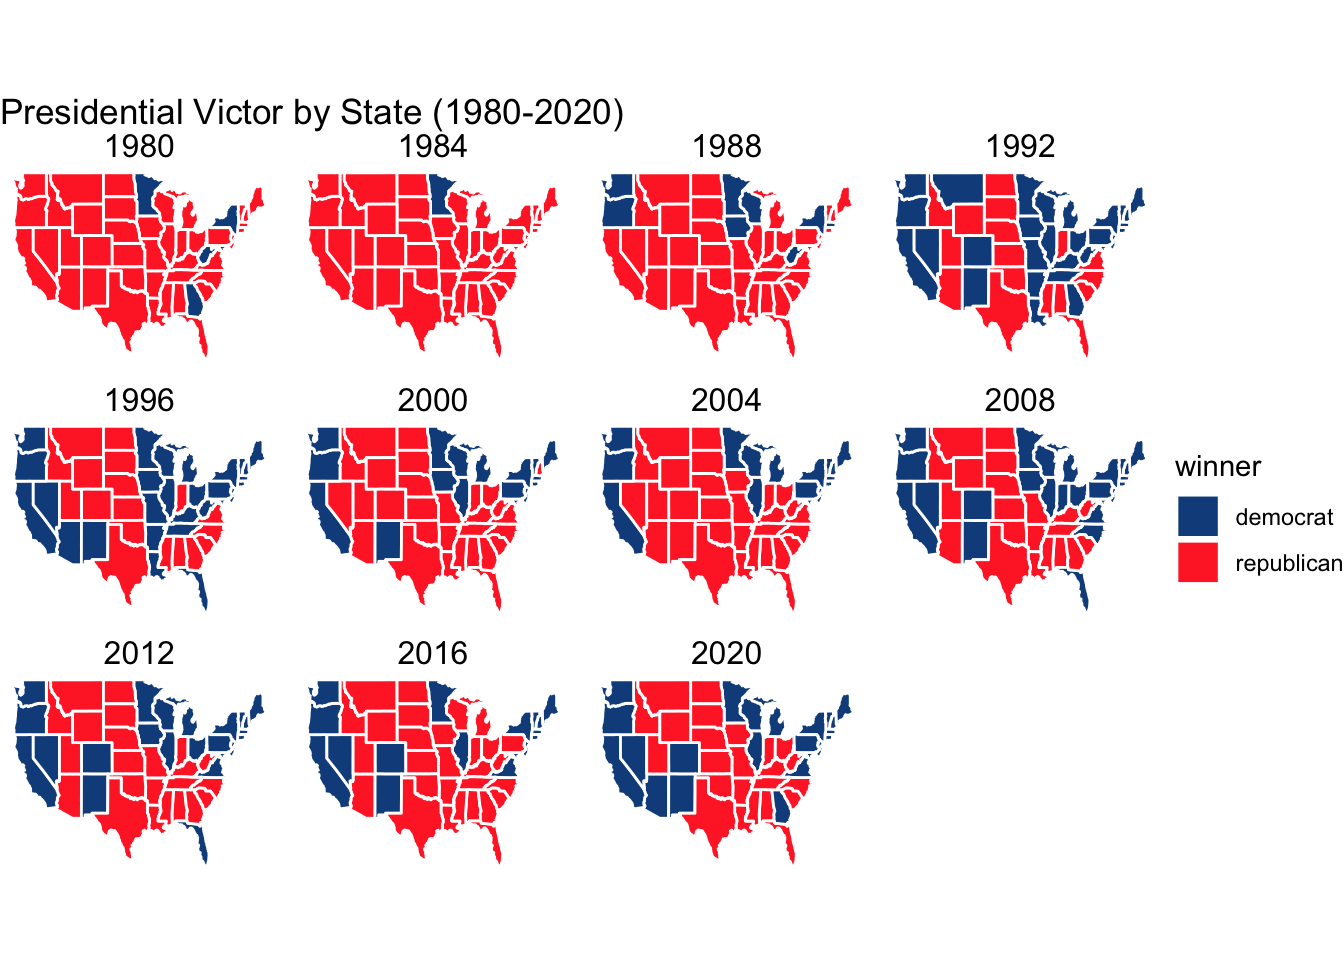
As can be seen above, there are significant changes to which states Democrats and Republicans win between 1980 and 2020. That said, it can also clearly be seen that many states, Wyoming and Montana for example, stay remarkably stable for Republicans and Democrats respectively. But this graphic obscures how close each of these states are. For example, while Minnesota has voted Democratic in every above presidential election, in 2016 Democrat Hillary Clinton narrowly carried it by a less than 2-point margin in the 2-party popular vote. To see how competitive states have been in past elections, we must analyze not just the winner, but the margin by which they won. The below graphic does just that.
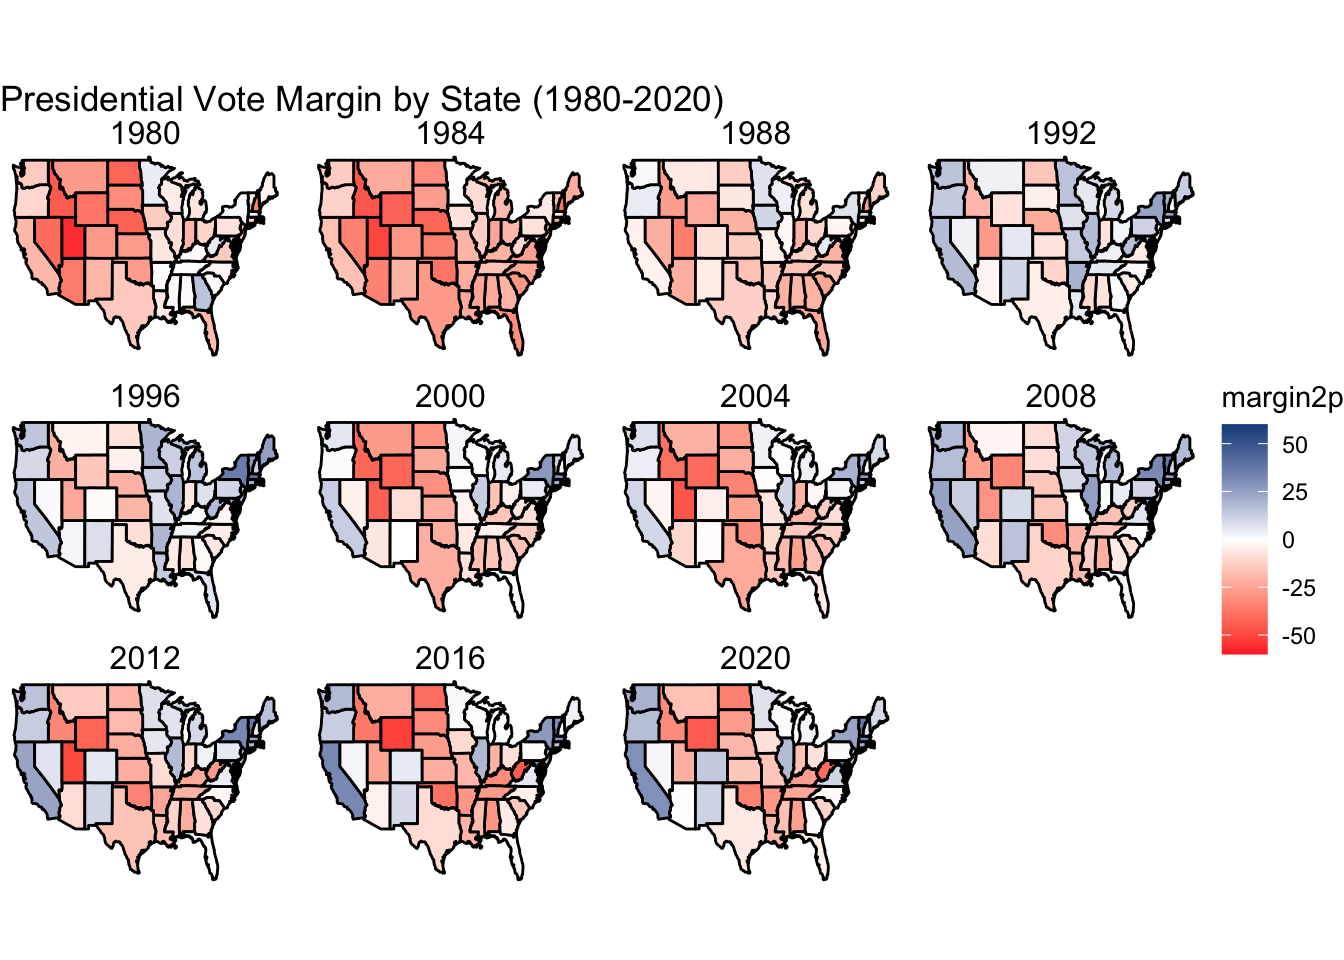
As can be seen, the presidential battleground states have changed over the years. 45 years ago, California, New York, and Tennessee were battleground states, while Nevada, Arizona, and Virginia were all safely Republican. In 2000, Oregon, West Virginia, and Tennessee all saw close elections while Republicans won Georgia and North Carolina fairly easily. Now in 2020, California, New York, Tennessee, Oregon, and West Virginia all went fairly strongly for one party or the other, while Nevada, Arizona, Georgia, North Carolina, and, to a lesser extent, Virginia all saw tight elections, with Democrats narrowly flipping Georgia for the first time since Bill Clinton’s strong 1992 victory.
State-Level Swings:
We can also visualize these changes by looking how states “swung” from election to election. The below graphic shows how many percentage points each state swung relative to the prior election.
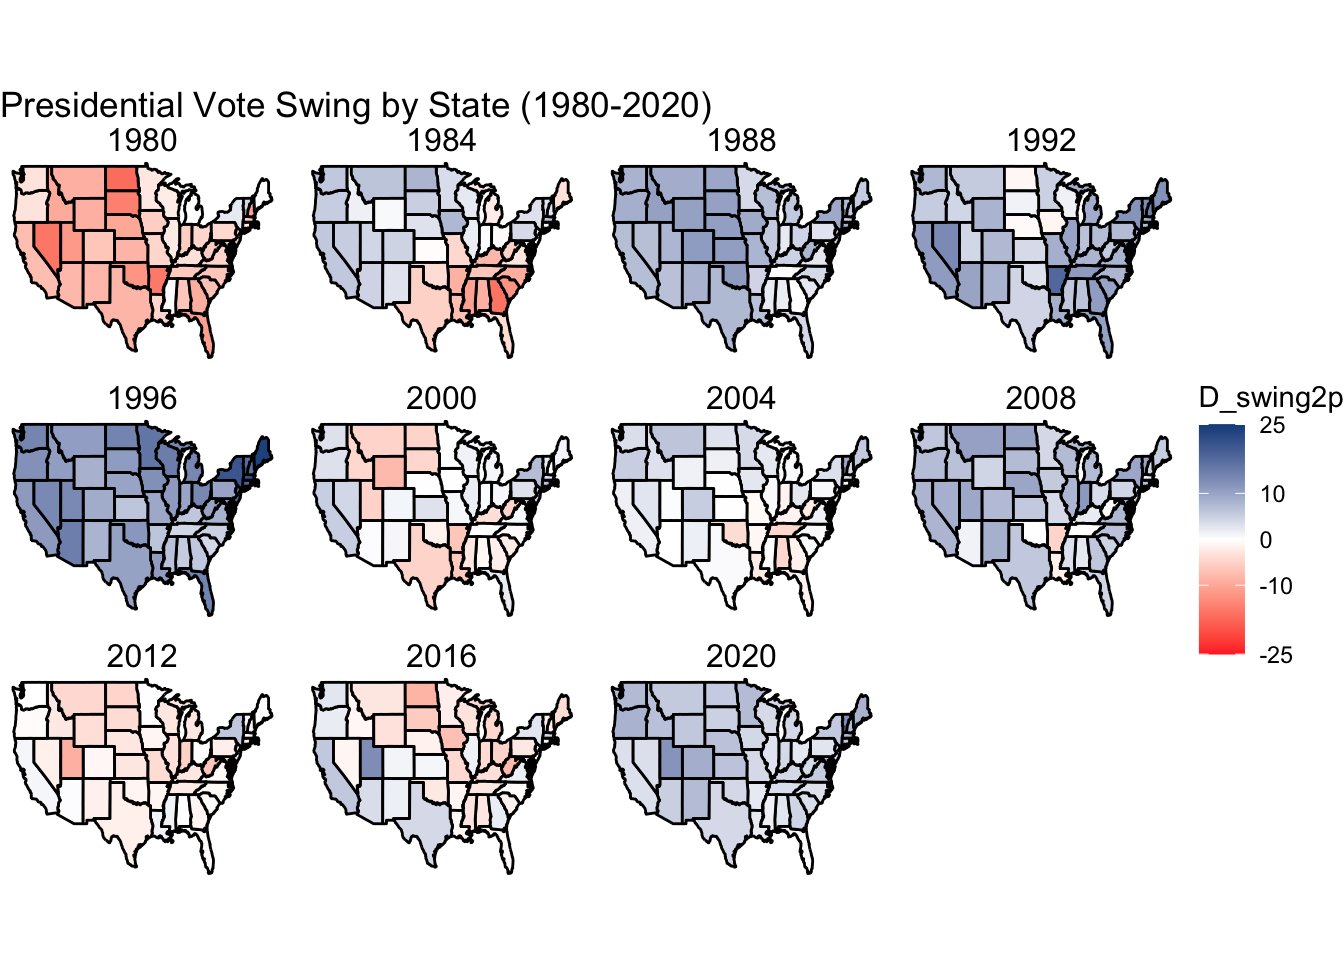
These maps are useful in understanding which regions trend differently from the rest of the nation. For example, while the national popular vote remained relatively stable between 1980 and 1984, ticking slightly up for Republicans, these gains were heavily concentrated in the south, while Democrats, despite doing worse nationwide, made notable gains in the West, Great Plains, and the Northeast. Another great example is in 2012. While Republicans made modest gains nationwide while trying to defeat President Obama’s reelection bid, the majority-Mormon state of Utah stands out as a state that swung particularly strongly for Republicans. This can easily be understood given that Republicans’ nomination of Mitt Romney made him the first Mormon major party nominee for president in American history.
Initial Prediction
Prediction 1: Based off of Past Election Results
Given what we have learned above about the history of presidential results and state-level trends, we can use recent electoral history to make a rough prediction of what the 2024 election results may be. Specifically, we can make a Simplified Electoral Cycle Model of Y_2024 = 0.75(Y_2020) + 0.25(Y_2016) where Y_year is the presidential margin in any given state in that year. We can then graph these results and tabulate how many electoral college votes each party would earn under this model.
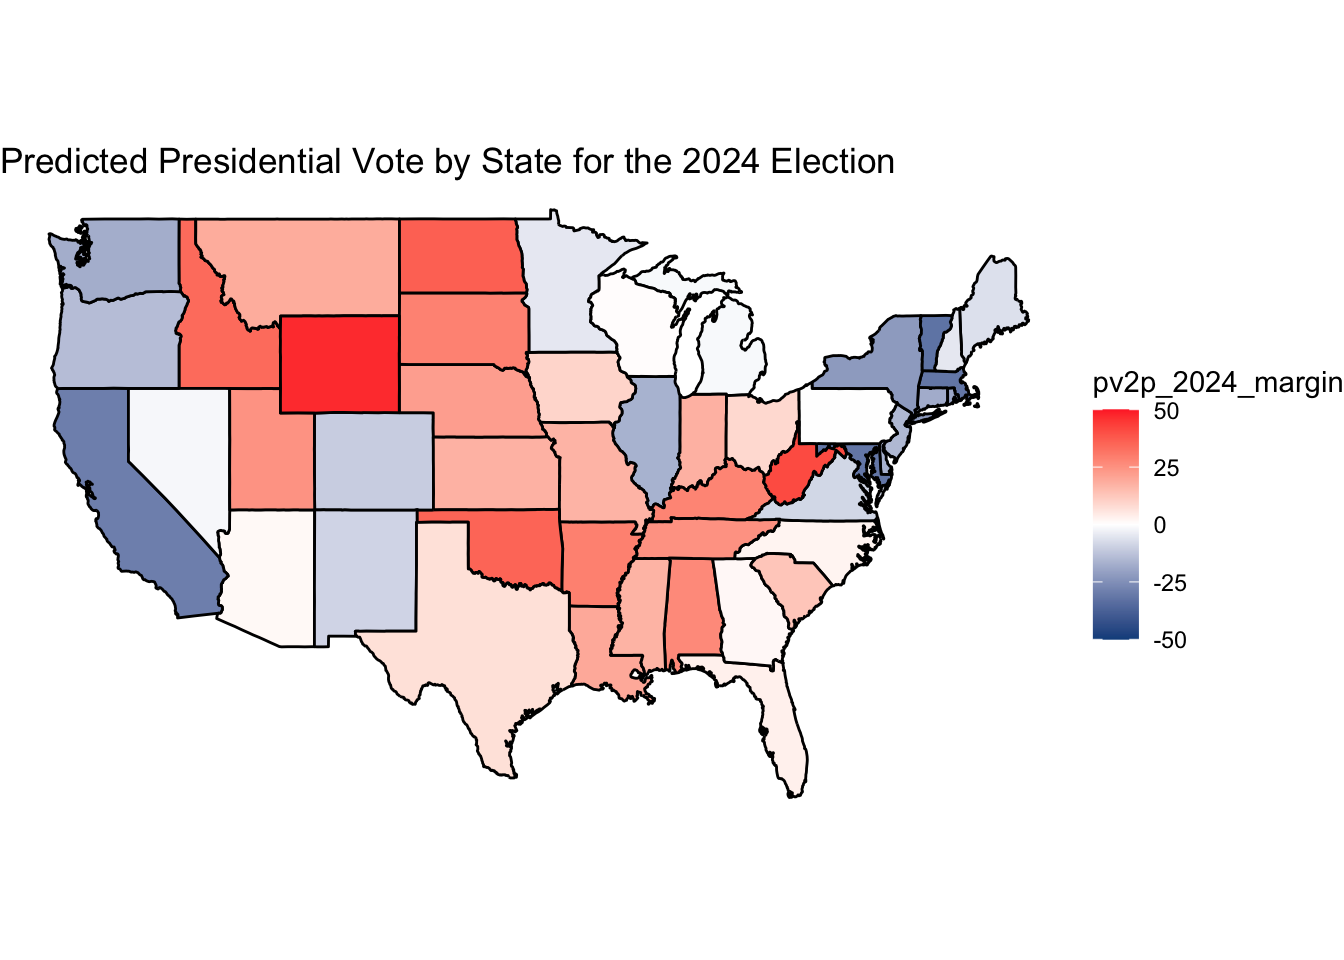
We can see that under this scenario, Republicans would flip back Arizona, Georgia, and Wisconsin, earning them 272 electoral college votes compared to Democrats’ 266, narrowly being enough for Republicans to flip back the presidency. In part, this makes sense. 2020 was a relatively good year for Democrats, particularly in the crucial, historically Republican states of Arizona and Georgia, while Wisconsin only narrowly swung left in 2020 despite that nationwide shift towards Democrats. Thus, we might expect Arizona and Georgia to regress towards their Republican roots while Wisconsin may continue to trend rightwards relative to the nation. This said, we should not base our 2024 prediction solely off of past election results, especially given that my basic model above only looks at the past two elections. Thus, I look forward to exploring other metrics by which to predict the 2024 election in the coming weeks!