Introduction
During election season, while the media focuses heavy attention on political rallies, fundraising numbers, and the chaotic political headlines that pass with each news cycle, many political scholars and strategists believe that certain “fundamental” factors, such as the strength or weakness of the economy, drive political trends much more than the billions of dollars presidential campaigns spend or the relative strengths and weaknesses of the candidates themselves. In this second blog post, I will seek to understand how predictive various economic measures, namely GDP growth and RDI growth, are of presidential election results, specifically the national popular vote share for the incumbent party.
Historical Trends
Gross Domestic Product (GDP)
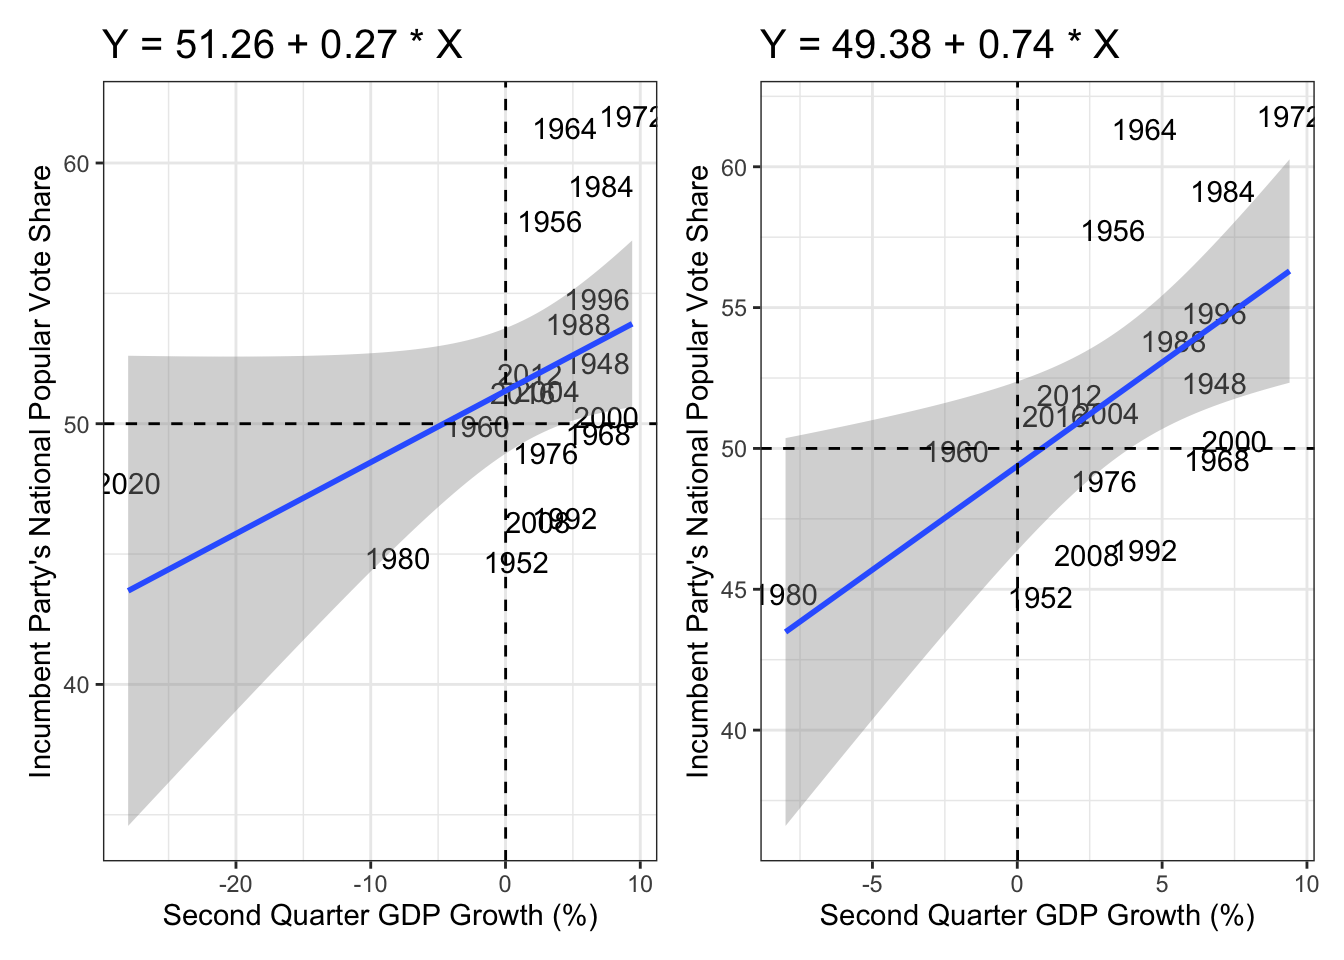
I will begin by looking at GDP growth data in relation to incumbent party vote share. Specifically, I will look at GDP growth in Quarter 2 (between April and June) of each election year, since this period is a fairly good representation of the short term economic outlook leading up to the election. The graphs below show the relationship between Q2 GDP growth and incumbent party vote share. The difference between the two below graphs is that the first includes the 2020 data point while the second graph does not. This difference is important given how much of an outlier 2020 was. Q2 in 2020 was at the height of the Covid-19 lockdown, and the country’s economy was in a state of utter chaos. Thus, testing this relationship both with and without 2020 is important.
| Incumbent Party Vote Share | ||||
|---|---|---|---|---|
| Predictors | Estimates | std. Error | CI | p |
| (Intercept) | 51.26 | 1.14 | 48.85 – 53.66 | <0.001 |
| GDP growth quarterly | 0.27 | 0.14 | -0.02 – 0.57 | 0.064 |
| Observations | 19 | |||
| R2 / R2 adjusted | 0.188 / 0.140 | |||
| Incumbent Party Vote Share | ||||
|---|---|---|---|---|
| Predictors | Estimates | std. Error | CI | p |
| (Intercept) | 49.38 | 1.42 | 46.37 – 52.38 | <0.001 |
| GDP growth quarterly | 0.74 | 0.27 | 0.17 – 1.30 | 0.014 |
| Observations | 18 | |||
| R2 / R2 adjusted | 0.325 / 0.283 | |||
These graphs and their accompanying regression tables show that there is a positive correlation between Q2 election year GDP growth ad incumbent party vote share in the corresponding November election. This relationship is much stronger when we exclude the 2020 outlier case, resulting in the slope of the line of best fit increasing from 0.27 to 0.74. This said, the R squared value of 0.28 for the 1948-2016 model remains fairly low, meaning that now much of the variation from the trendline can be explained by the model.
Real Disposable Income (RDI)
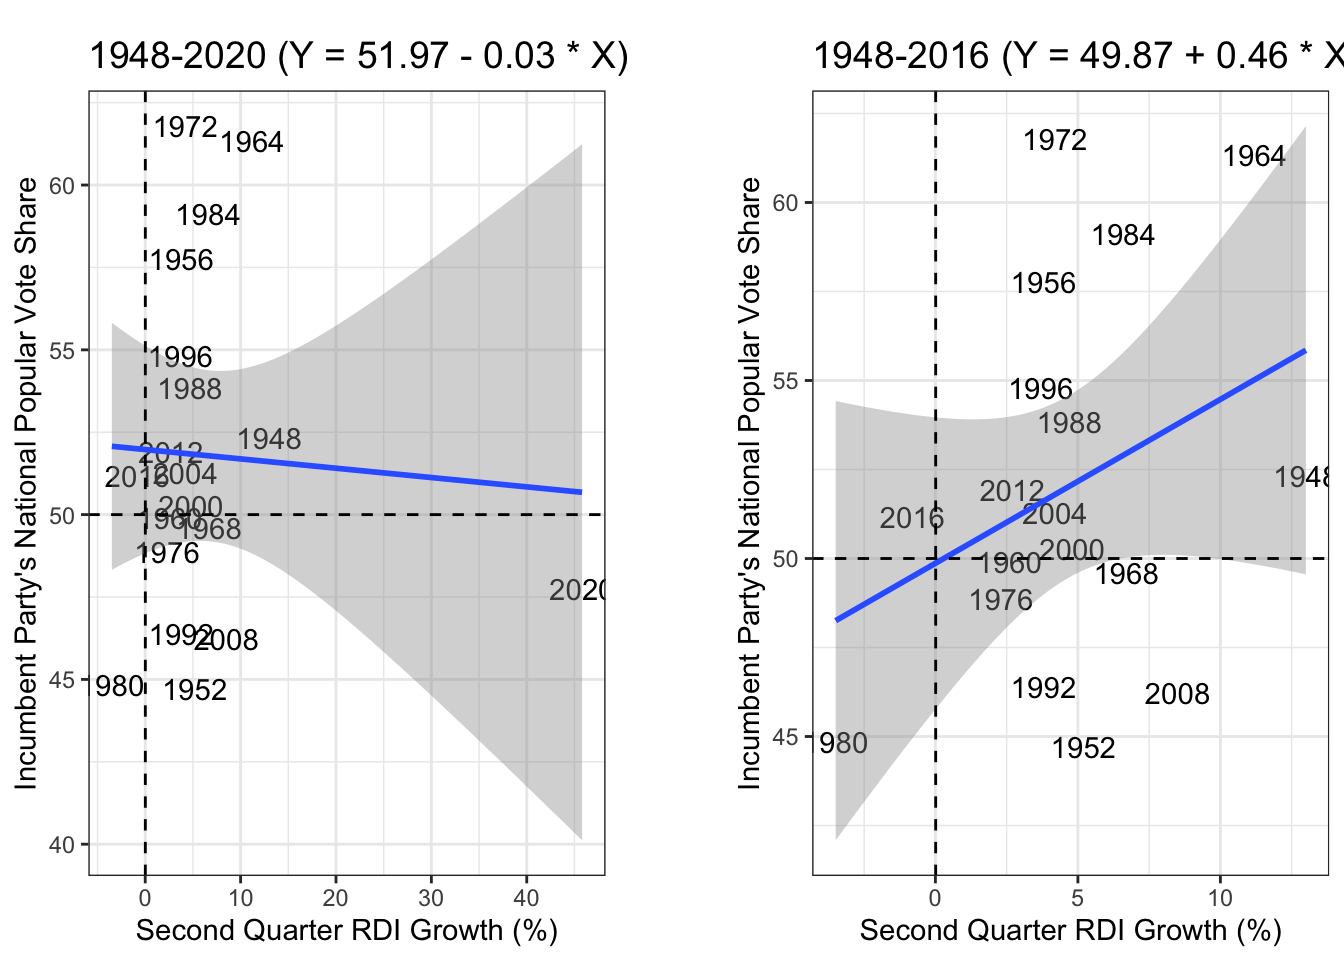
Given that Q2 GDP growth clearly has a correlation, but, predictably, does not fully explain election results, it is useful to see how a different measure of the strength of the economy, changes in Real Disposable Income (RDI), relates to the election results. Some argue that RDI, at least in theory, is a better predictor of electoral trends because it is a measure of how much money voters actually have in their pockets, compared to GDP which is a measure of the collective strength of the economy, regardless of how individuals within the economy are fairing. Like the graphs for GDP growth, the two graphs below first include and then exclude the 2020 outlier case, and I look at changes in RDI in Q2 of each election year.
| Incumbent Party Vote Share | ||||
|---|---|---|---|---|
| Predictors | Estimates | std. Error | CI | p |
| (Intercept) | 51.97 | 1.49 | 48.82 – 55.12 | <0.001 |
| RDPI growth quarterly | -0.03 | 0.12 | -0.29 – 0.23 | 0.823 |
| Observations | 19 | |||
| R2 / R2 adjusted | 0.003 / -0.056 | |||
| Incumbent Party Vote Share | ||||
|---|---|---|---|---|
| Predictors | Estimates | std. Error | CI | p |
| (Intercept) | 49.87 | 1.93 | 45.77 – 53.96 | <0.001 |
| RDPI growth quarterly | 0.46 | 0.32 | -0.23 – 1.15 | 0.176 |
| Observations | 18 | |||
| R2 / R2 adjusted | 0.111 / 0.056 | |||
As can be seen in both the graphs and the coressponding regression tables, the 2020 outlier significantly changes how predictive changes in RDI are, with the slope of the line of best fit jumping from -0.03 to +0.46. This said, this second, better fitting positive correlation is a notably worse relationship than Q2 GDP growth, both in terms of the slope of the trendline being less steep and in terms of the R squared value, which in this case is a very small 0.056. Thus, Q2 GDP growth is a better predictor of electoral results than Q2 RDI growth.
Incumbents vs Incumbents’ Heirs
GDP growth
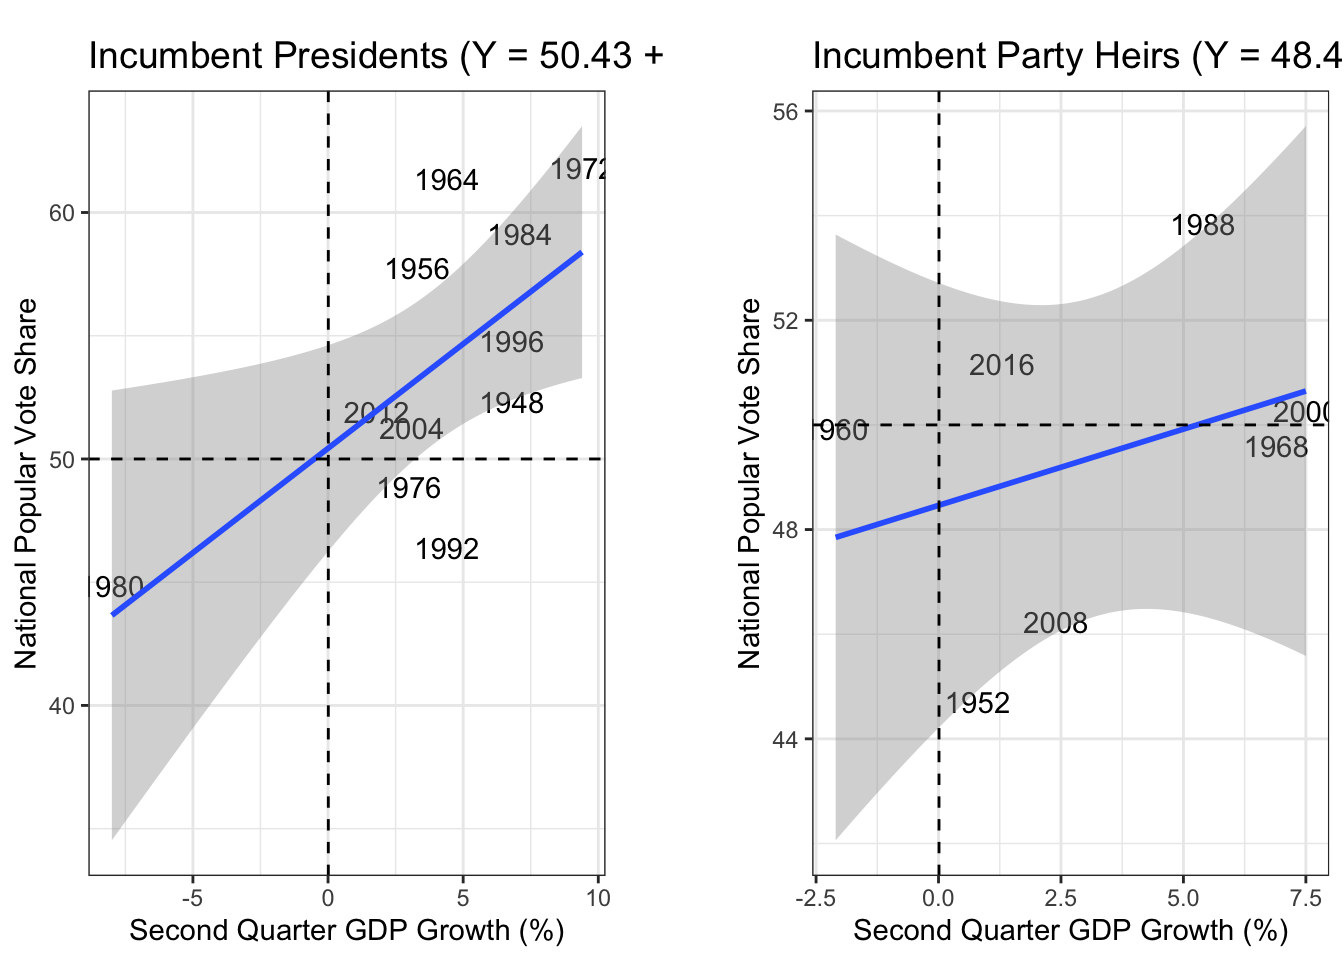
I will now look at whether these relationships hold up when the incumbent party’s nominee is not the incumbent themselves. This distinction potentially matters because if the economy is doing particularly well or particularly poorly, voters may not respectively give credit or blame the incumbent party’s candidate given that they were not in power to cause these changes. This distinction is of particular importance when looking at the 2024 election given that President Biden has stepped aside to allow his heir, Vice President Harris, to run instead.
| Incumbent Presidents | Incumbent Party Heirs | |||||||
|---|---|---|---|---|---|---|---|---|
| Predictors | Estimates | std. Error | CI | p | Estimates | std. Error | CI | p |
| (Intercept) | 50.43 | 1.85 | 46.25 – 54.61 | <0.001 | 48.46 | 1.65 | 44.21 – 52.72 | <0.001 |
| GDP growth quarterly | 0.85 | 0.32 | 0.12 – 1.57 | 0.027 | 0.29 | 0.36 | -0.64 – 1.22 | 0.458 |
| Observations | 11 | 7 | ||||||
| R2 / R2 adjusted | 0.437 / 0.375 | 0.114 / -0.063 | ||||||
These graphs show that there is a much weaker correlation between Q2 GDP growth and incumbent party vote share when the incumbent party’s nominee is a successor rather than the incumbent themselves. The slope of the line of best fit drops from 0.85 to 0.29, and the R squared value drops from 0.375 to -0.063. This shows that Q2 GDP growth has very little predictive power when the incumbent themselves is not running for reelection.
RDI Growth
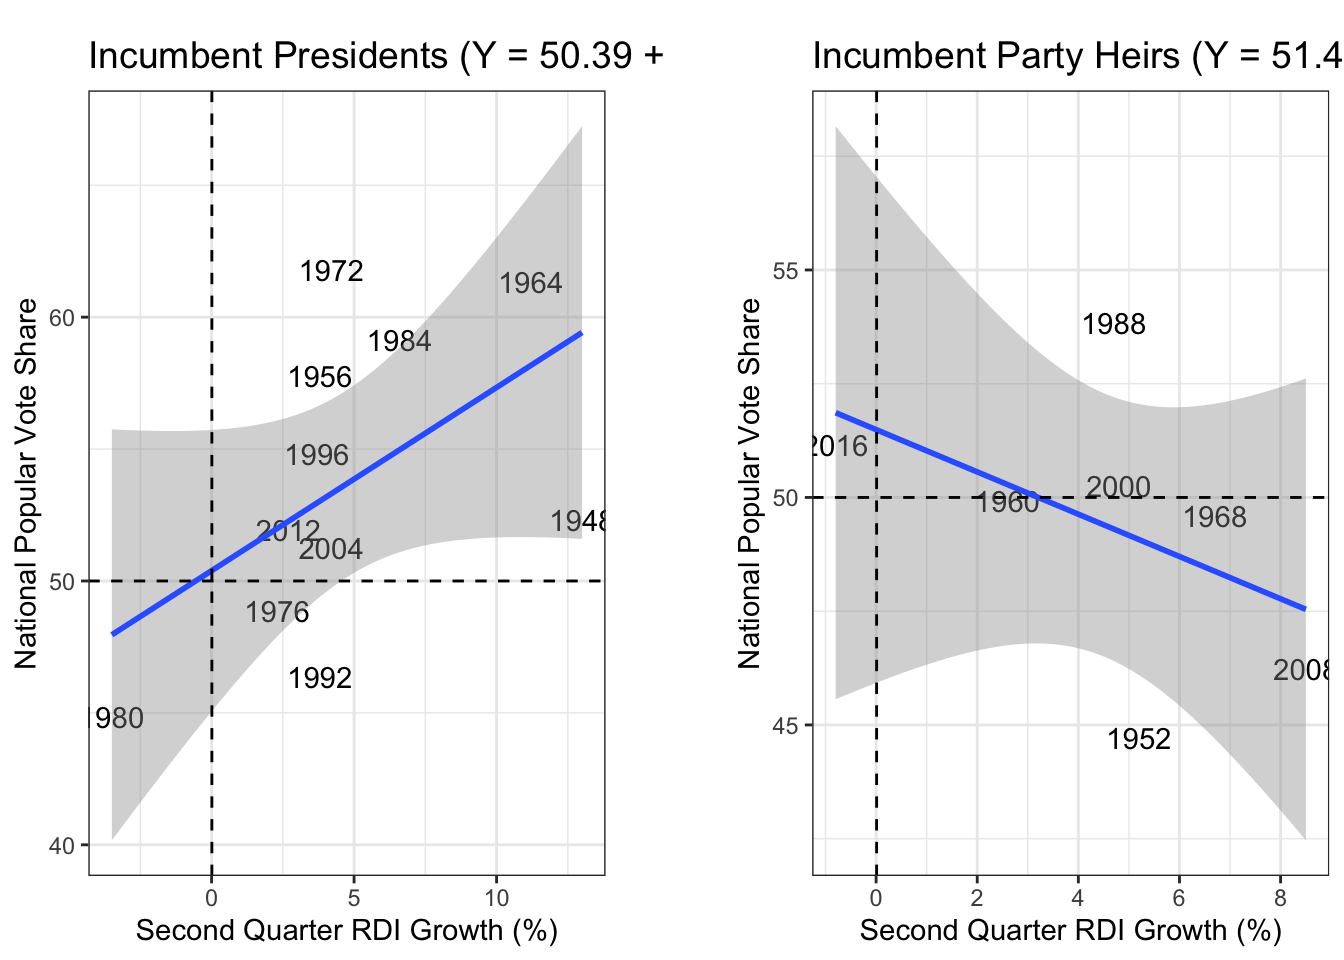
If we repeat this test for Q2 RDI growth, a similar story plays out
| Incumbent Presidents | Incumbent Party Heirs | |||||||
|---|---|---|---|---|---|---|---|---|
| Predictors | Estimates | std. Error | CI | p | Estimates | std. Error | CI | p |
| (Intercept) | 50.39 | 2.36 | 45.06 – 55.73 | <0.001 | 51.49 | 2.17 | 45.92 – 57.06 | <0.001 |
| RDPI growth quarterly | 0.69 | 0.37 | -0.15 – 1.54 | 0.095 | -0.46 | 0.41 | -1.51 – 0.59 | 0.307 |
| Observations | 11 | 7 | ||||||
| R2 / R2 adjusted | 0.279 / 0.198 | 0.206 / 0.047 | ||||||
As can be seen in the above graphs and regression table, when the incumbent is not running for reelection the slope of the line of best fit decreases from 0.69 to -0.46, while the R squared value decreases from 0.198 to 0.047. This shows that when the incumbent party has a non-incumbent nominee, there is not even necessarily a positive correlation between Q2 RDI growth and incumbent party vote share, and the R squared value tells us that whatever relationship there is does not explain very much.
2024 Prediction
While these models and relationships are certainly imperfect, that does not mean they do not carry any predictive power, as the relative strength or weakness of the economy has an undeniably large impact on the election, even if it does not completely explain to results. As such, I have made the following predictive models for how much of the national popular vote Vice President Harris will win:
Based off of Q2 GDP Growth:
##        fit      lwr     upr
## 1 51.58486 41.85982 61.3099
Based off of Q2 GDP Growth for Incumbent Party Heirs:
##        fit     lwr      upr
## 1 49.33617 40.6918 57.98053
Based off of Q2 RDI Growth:
##        fit      lwr      upr
## 1 50.32576 38.89587 61.75566
Based off of Q2 RDI Growth for Incumbent Party Heirs:
##        fit      lwr      upr
## 1 51.02614 42.04159 60.01069
As can be seen, these four models predict a tight election, but one where Harris should earn slightly above 50% of the national popular vote. This is a promising sign for Harris going into the last 50 days of the election,